The Mobile Advertising Conundrum

If you do not change your direction, you may end up where you are heading.

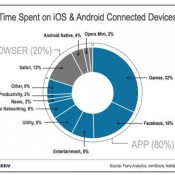
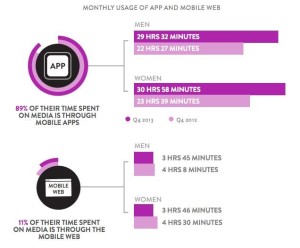
The conventional wisdom in mobile advertising is that application inventory constitutes roughly 80(ish) percent of available inventory. This, as a general statement, is true. Without fail, every survey or OS use measurement stat states that somewhere between 80-89% of time is spent in apps. Often that translates into advertisers’ mobile advertising mix mirroring that ratio – or an even higher percent in-app.

Nielsenmonthlusagemobileappdevices1.png

Yet, when it comes to opportunities reaching interested consumers on mobile devices there may be some facts not taken into account that might be worth review. Simply, how do customers use apps versus the mobile web, and does that constitute a change in ad receptivity?

More often than not the point of advertising is to convert/conquest/add new consumers and loyalists. App usage follows some patterns that may be antithetical to this goal.

 Mobile-app-use-media-2013-600x483

Apps are used for activities like social networking, gaming and entertainment

  • App activities are typically high engagement which cause a higher amount of time spent
  • High usage regularity means the same eyeballs are often seeing the same ads…and still not engaging
  • Mobile websites are a part of the shareable internet, which means their discoverable

 Google Mobile Shopper

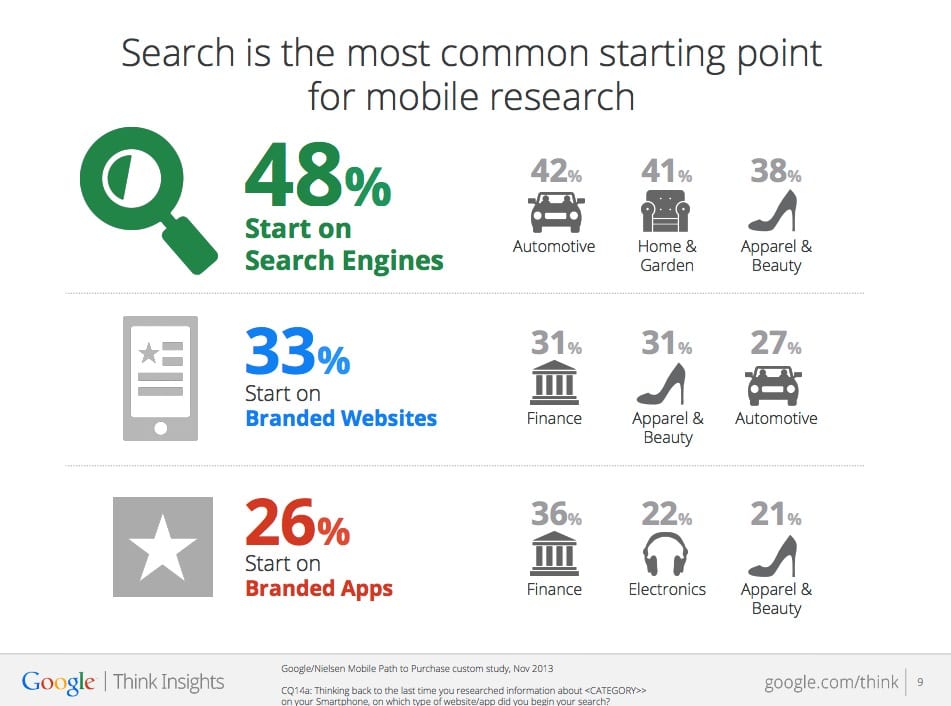
The above statistics from Google highlight that branded apps only represent 26% of research while over 87% of researchers are starting on search or websites. On the surface this seems like a great stat for mobile search advertising, which it is. On second thought, it’s also a statistic that tells us even more about behavior which can be helpful for mobile display advertising. When on mobile sites, users are more in discovery mode. If engagement rates from mobile devices tell us anything, it’s that an enormous number of impressions go either unnoticed or not interacted with in any way.

If the preponderance of ads are served in an environment where behavior is less conducive to ad engagement, simply due to mindset during use, then it is likely that there will be fewer opportunities to engage prospects. Yet, the data, location reporting and app traffic is high in-app. This presents a serious conundrum.

In this post, I don’t give the answers, only ask the question…

Should app-based advertising be a smaller mix than the 80% traffic volume it represents?

Are we putting enough incentive on mobile web publishers to provide better data for advertising effectiveness?

Do you have other questions you want answered? Calling all advertisers, mobile data providers, ad servers and publishers – what say you?

What I’m trying to say is, the most traffic isn’t necessarily the right traffic and if it isn’t then what’s the right move to make when considering a mobile display advertising campaign?


Share

Location is the New Con…

In advertising technology, we’re prone to using comparative language to explain a product or service to another product or service in popular use, because the product development, technologies and uses in this industry are typically greenfield. In other words, they’re not just improvements on ideas they’re typically completely new. For instance, a person may describe Instagram as Twitter with pictures instead of text. Or, one might compare an advertising exchange to the stock exchange – who may then need to compare a stock exchange to a cattle auction with detailed spec sheets on each bovine, depending on the audience.

“Analogies prove nothing that is true.”

We learned in grade school, that this process of comparison is called an analogy. Analogies can be defined as the comparison of two things to highlight some point of similarity so that understanding of the one being defined is more easily attainable. This, however, doesn’t make them necessarily true. Sigmund Freud said, “Analogies prove nothing that is true.” Freud is a genius. While comparison certainly allows the listener to more easily grasp a concept that does not necessitate actuality, or truth as Freud put it, to the genuine likeness of said comparative subjects.
There are multiple speakers, companies and Powerpoint decks chock full of language comparing location to the cookie. Desktop display blazed the behavioral data trail well before anyone believed that smartphones would one day overtake desk/laptops as the main access point to the internet. Therefore, great mental capital was expended on explaining how internet cookies (a piece of text a web server can store on a user’s hard disk) allow advertisers to understand online behavioral patterns, thusly, what type of person/profile is running the machine. Furthermore, there was even greater energy expelled on dissuading brands from utilizing content or context to make online ad buys because cookie (behavioral) technology was a better determinant of audience.

Content and Businesses

Location Context in NYC

Success! Many companies began to buy advertising this way and the behavioral targeting industry was born. Then, along came mobile. Cookies don’t really work for mobile advertising for a litany of reasons in which this post need not delve. Instead, let’s focus on what does work in mobile really well – location. Given that just about everyone with a smartphone takes it with them everywhere they go, the signals given off by their GPS tell a story about that person. With that in mind (and using Freud’s analogy to truth principle as a backdrop) there may be another more apt analogy to use that accurately describes what location does for advertisers. That is, “location is the new con…” Pick your con, be it ‘text or ‘tent. Just, don’t call it the new cookie.

Location allows us to intermingle understanding of the physical world and visitation patterns to define interest and intent. This is extremely powerful. As my cohort, Dan Silver, suggested, building location based audience is a cocktail of a multitude of inputs. Unlike the cookie, location takes into account real-world behavioral data that can be verified through location verification. Location also integrates 3rd party data associated with a given location for even greater understanding. Plus, phones are rarely shared, so reaching the intender is all but guaranteed when serving an ad. Lastly, there is a much higher barrier to entry to going someplace, so luxury item targeting is more precise than with cookies. Cut to scene of teenager clicking on Porsche ads. These truths, along with the fact that mobile advertising can be proven to understand ad influence through visitation study, makes for a much more robust picture of an audience and advertising impact than can be delineated via the cookie.

So the next time you’re in a room full of advertisers asking about location technology and how it works tell them, “It’s the new con…” A combination of the content associated with the visitation data surrounding that discrete latitude/longitude, plus the context of what the events, businesses, and/or homes are comprised of in that location. Hopefully, you’ll be able to help them understand the truth about location targeting more accurately through that analogy.

Share

The Rise of Real-Time Analytics

Yes, that’s it, another Three Letter Acronym (or TLA for short) – Real-Time Analytics. It’s been proven that it’s beneficial to bid in real-time, creating an auction style marketplace for ad inventory. But why not analyze and react to the analytics variables received, in real-time as well? Mobile users have an array of meta data associated with location, plus time, sentiment, etc. If I were an advertiser, I’d be most interested in valuing my impressions appropriately, based on things like audience characteristics, location and behavior. While, today, most RTB platforms do an excellent job of bidding on impressions based off of pre-defined parameters, I’m excited for the day when the programmatic space, especially in mobile, is using big data, not unlike PlaceIQ’s, to analyze buying decisions combining intelligence with auction to create smart auctions. We often hear about analytics driving real-time decisions, but truly dig deep and you’ll find that is just not the case. Usually, data’s used in a predictive nature. Moving toward real-time could be potentially game changing and add value to inventory, while increasing budgets toward programmatic sources. [Read more…]

Share

Google+ Ripples = Analytics Gold

Earlier today, I called Google+ “my weird friend that I don’t know why I hang out with so much, but for some reason I do.” Then, they do something like come out with Ripples that brings the spark back like a weekend away from the kids, with a bottle of wine and corresponding bottle of Cialis for the middle aged couple. I’ve made no secret of how much I think G+ changes the game, but ripples could be social media marketing and analytics gold for the troubled Marketing Manager still trying to explain the value of social connection and exponential value. ROI anyone?

Well, now you have it – ROI that is. First, Google wows you with a cool visual to show you how many times your post was shared. The arrows show who shared with whom.

Ripples Bubble Diagram

Then, you can check out the actual sharer and the content they posted along with the share. This is interesting, because you can see if people felt the same way about the content as you.

Now we’re having some fun! So, I mentioned that this was analytics gold. Well, here it comes compadres. If you see the top of the preceding picture, you’ll notice that there is a sharing timeline that shows when the bulk of the activity happened. For most of the posts I have reviewed, it was right after the post and a few hours after. However, if you have a particularly viral post that string will flow out much longer. Also, there are pie charts of influencers. I didn’t make the “influencer” category on this post, but I’ll keep sharing and posting and one day we’ll crack the code here in the Hand Raiser offices.

How do you take advantage of ripples? Well, you just click the dropdown box beside the post you want to check and click “View Ripples.” You will only see the View Ripples link on public posts and shares, so don’t get discouraged if you don’t see it right away.

The benefit to the typical business is the ability see just how much action and potential views posts are garnering, for free. You can also click in to the names of the sharers to see what your influencers/customers/enjoyers of your content are like, building a profile of your social media connections.  Lastly, if your content isn’t being shared, search for ripples that are exploding so you can learn what content goes viral. It can help you decide when and what to share.

Ripples can be fun, but also very useful to a marketer. How do you use ripples? Do you think this is something that you’ll make use of when you get famous and go viral?


Share

Detroit NewMe Community Meetup

Detroit NewMe Community

Last night, I had the distinct honor and pleasure to be in the company of some very talented and intelligent individuals, via the Detroit NewMe Community Meetup group, at TechTown Detroit. I was instantly inspired by the accomplishments, struggles and general dynamism of the group. I’m looking forward to continuing a prosperous relationship with all who are able and willing to make worthwhile contributions. The cause is just. As in many industries, tech is dominated by a few, and the startup world, especially. This group is working toward breaking down the knowledge barrier between often disenfranchised communities and the at-large startup tech industry.

On this particular night Hajj Flemings, an inspiration to many young blacks aspiring toward tech greatness, spoke about the high level strategies involved in developing a startup pitch slide deck.This gentlemen is a contributor to BE.com, founder of Brand Camp University and co-founder of the startup gokit.me He broke down the various necessary sections to include in such a deck, and even expounded on some of the elements that makes those sections capture the attention of a potential investor. Those sections are:

  1. General Business Info and Company Name
  2. Define the Problem
  3. Discuss the Solution Your Company Offers
  4. Market Size
  5. Business Model
  6. User Acquisition Strategy
  7. Competitive Advantage
  8. The Ask
  9. The Team
  10. Contact Page

Additionally, we heard from James Norman, the CEO of Ubi, the next Detroit startup accepted to the NewMe Accelerator, in the second year of its existence. I just signed up for the service but was quite impressed with what I heard from the Founder and CEO on this evening.

I’m looking forward to learning, sharing and contributing more with this group of individuals as there was a plethora of talent in the room. I am excited to offer regular updates about the traction of my own, and all the startups represented here. If interested, feel free to contact me or hit the website to join. We’re open to include more like minded individuals to create a robust support group to benefit all of the aspirational goals of the people in this area and to grow the tech business landscape in Michigan.

Share